単一カラム
基本
カウントして、順番を並べ替えておく
使用するライブラリ・関数
pandas.Series.value_counts() pandas.Series.sort_index()
matplotlib.pyplot
参照サイト
kaggle Titanic – Machine Learning from Disaster
棒グラフ
# Pclassごとの乗客数
pclass_counts = df.Pclass.value_counts().sort_index(ascending=True)

# 値ラベル表示関数を定義
def value_label(lst):
    for i in range(len(lst)):
        plt.text(i, lst.iloc[i], lst.iloc[i], ha="center")

pclass_counts.plot.bar(rot=0) # rot は xlabelの角度
plt.title('Passenger Count by Pclass')
plt.xlabel('Pclass')
plt.ylabel('Count')
plt.grid()
value_label(pclass_counts)
plt.show()

print(pclass_counts)
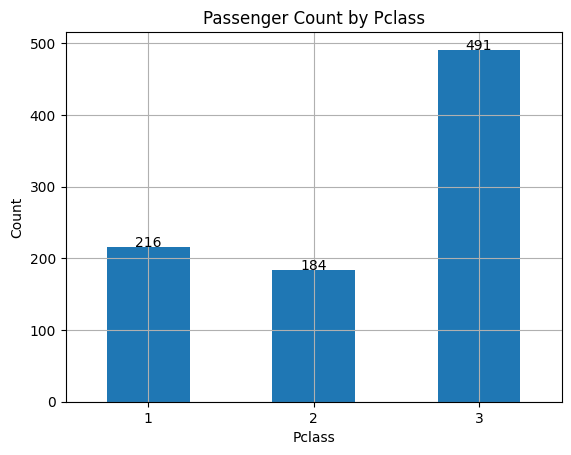
1 216
2 184
3 491
Name: Pclass, dtype: int64
複数カラム
基本
カウントして、順番を並べ替えておく
使用するライブラリ・関数
pandas.DataFrame.value_counts() pandas.DataFrame.sort_index()
matplotlib.pyplot
参照サイト
kaggle Titanic – Machine Learning from Disaster
棒グラフ
積み上げ棒グラフ
100%積み上げ棒グラフ